Diva Awanisa Nahdi

Fresh Graduate in Engineering Management at Institut Teknologi Bandung
A lifetime student with educational and professional experiences in data analytics and strategic management. This is my portofolio page for Data Analytics using Python, R, SQL, and Tableau
View My LinkedIn Profile
Data Portfolio
The portfolio is redirected to notion format for better features (updated version).
Click here to access : Notion Link
Old Version:
Data Analytics with Python
Digital Bank Service Positional Mapping
Mapping offered service positiong among digital bank brands in Indonesia using NLP, Jaccard Similarity, Binomial Proportion Test,
and Principal Component Analysis. The position map is deployed using Heroku server to ease user in interpreting the model result
Employee Turnover Prediction
Predicting employee resignation with Random Forest Classifier, Decision Tree Classifier, Light GBM Classifier, and XGBoost Classifier. Process covered: data exploration, missing value treatment, imbalance treatment, grid search, k-fold validation.
E-commerce EDA
E-commerce data are explored to gained insights and provide recommendation. Include clustering models based on customer RFM to group customers based on their Customer Lifetime Value
Students Performance EDA
Students data are explored to gained insights and provide recommendation
Female Daily Review Extraction
Reviews are extracted using Python, specifically using BeautifulSoup package. The extracted reviews are cleaned first using several
Python Function and Regular Expression (RegEx), resulting a ready-to-use data
for further analysis, like sentiment analysis or topic modelling.
Data Analytics with SQL
Parch & Posey Data Exploration
Parch and Posey is a fictional poster store and required data analyst to provide insight using SQL queries.
The data and problem questions are sampled from Github Profile “ptyadana” but I made the all the SQL answers.
I used Microsoft SQL server 2019 to write and process the SQL Queries.
Data Analytics with Tableau
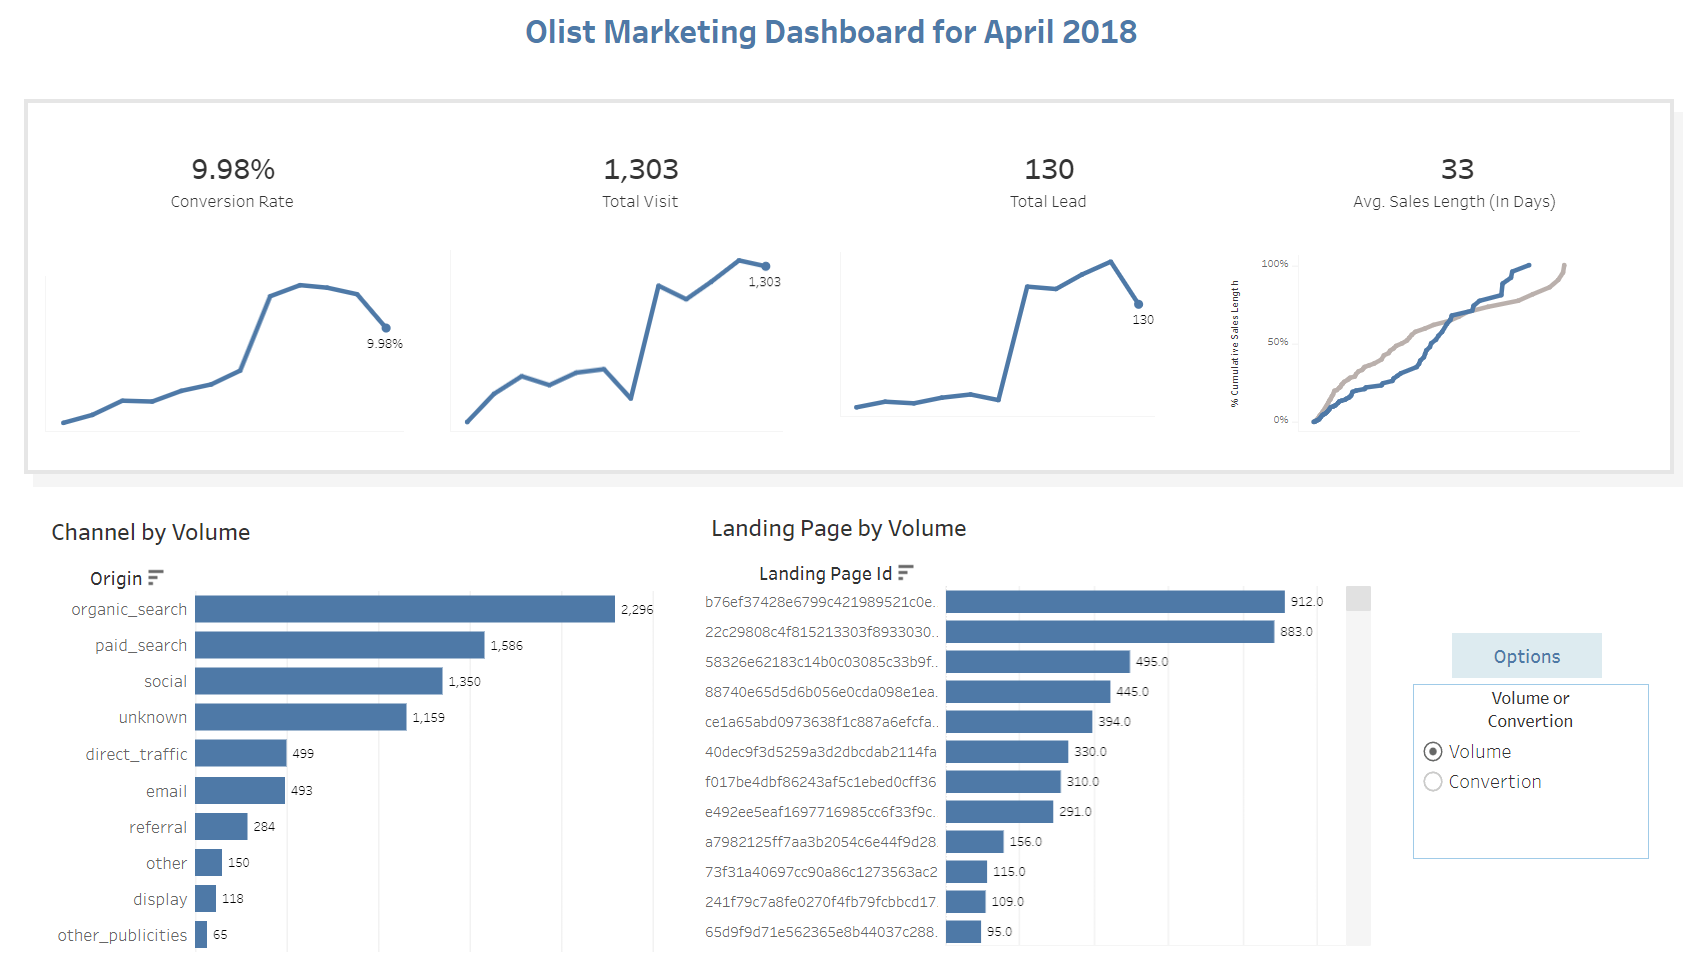
Olist marketing Dashboard
For monitoring the lead number of Olist E-commerce. Data source: Kaggle
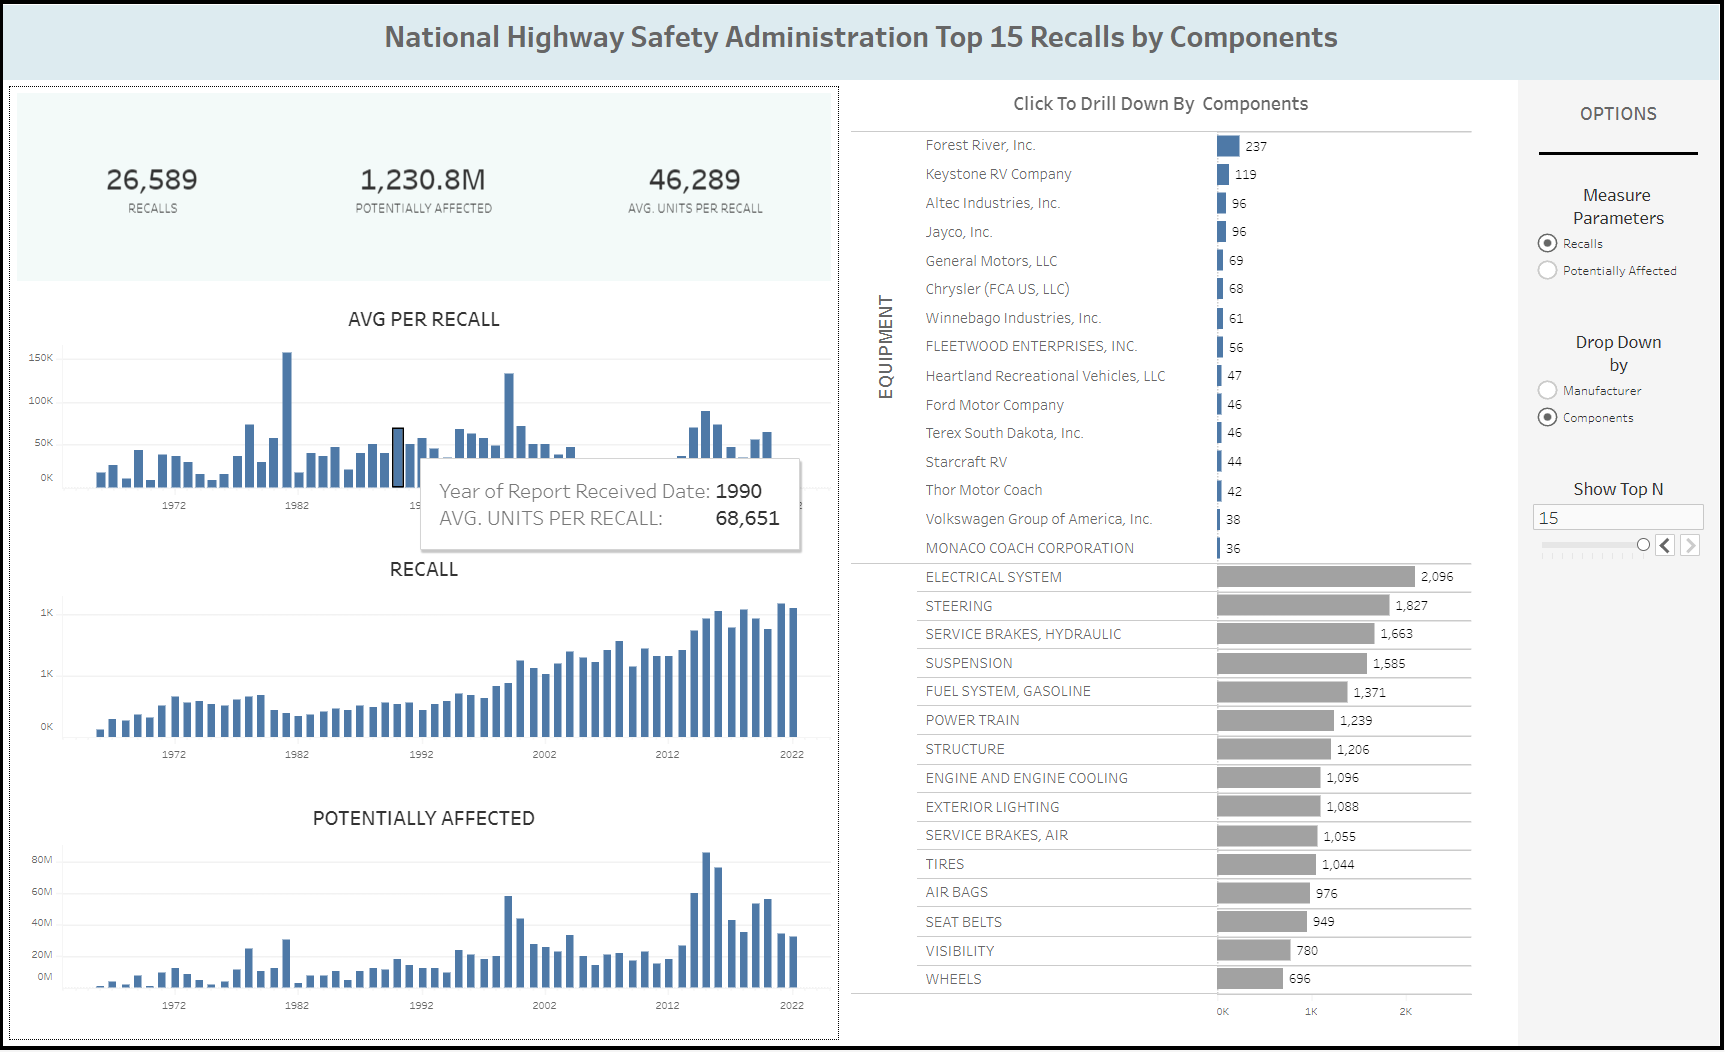
NHTSA Vehicle Recall Dashboard
For monitoring the number of automobile recall. A practice project
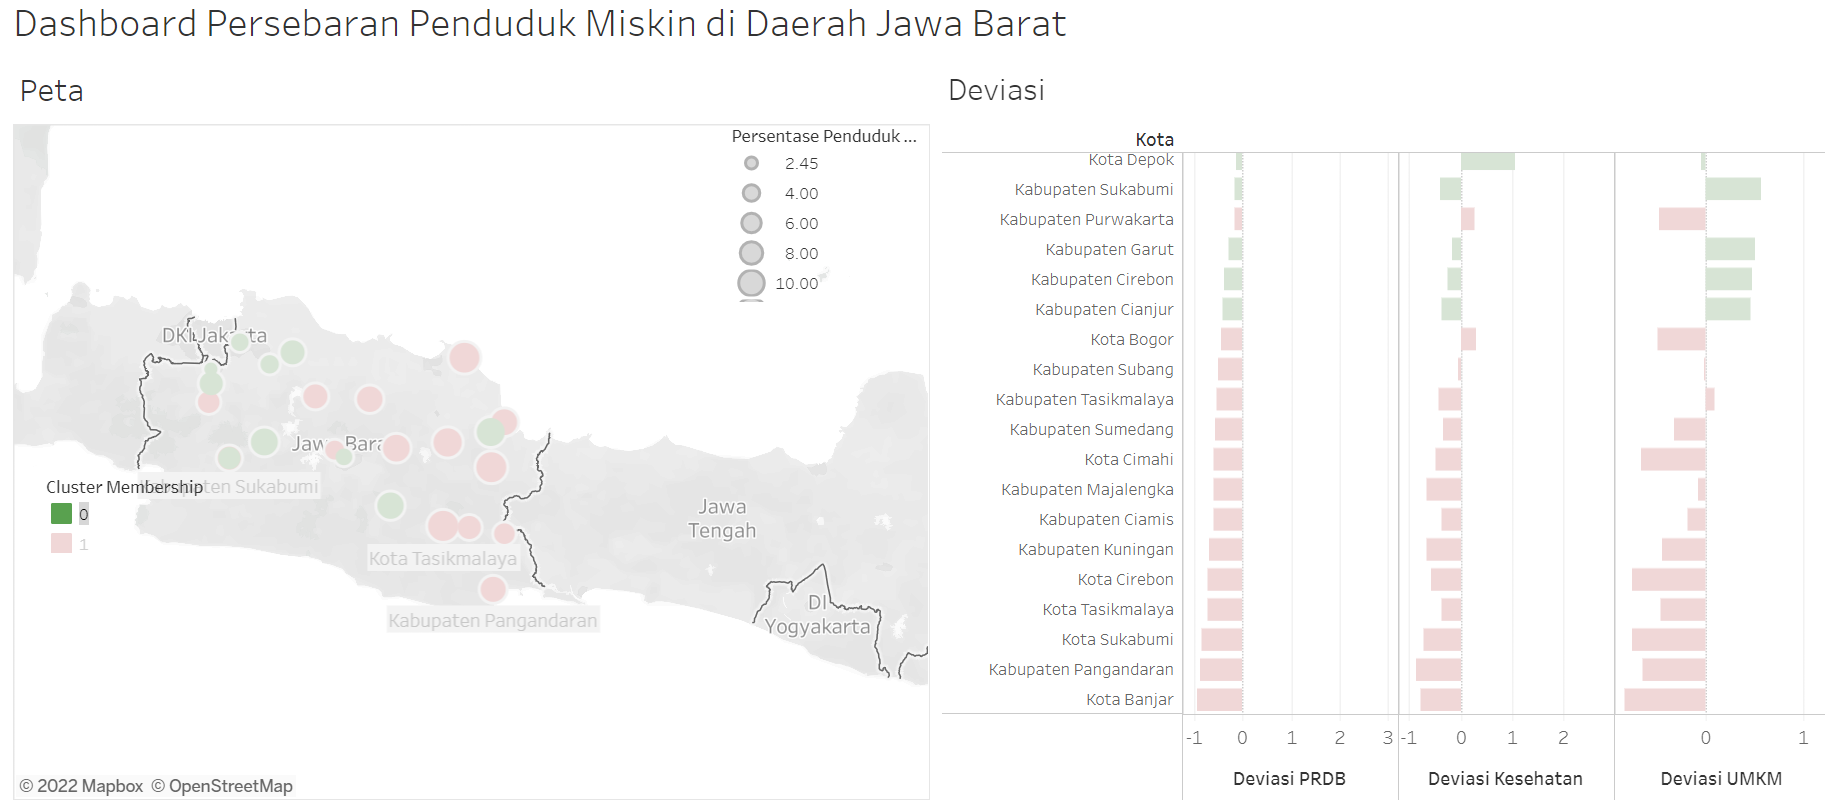
West Java Poverty Analysis
This graphics are used to fulfill one the data analysis competition requirements, resulting my team achieving the 2nd runner up place in the competition
back in October 2021
Data Analytics with R
Forbes Data Exploration
Data exploration for top companies according to Forbes. Code and explanation are made by my team for Data Science group project.
Auto MPG Data Exploration
Data Exploration for cars, using the default dataset of autoMPG from RStudio. Code and explanation are made by my team for Data Science group project.